Data analysis
The analysis view provides tools for quantification and visualization of the data.
Cell selection
Select cells based on their current developmental state:
All cells
Only swarmer cells w/o stalks
Only cells with stalks
Only cells with stalks w/o buds
Only mother cells with stalks connected to buds
Only buds
Only deleted cells
All cells incl. deleted cells
Cell table
The cell table contains the subset of all cells selected at the top row (see Cell selection), which fullfills the criterium set up at Filter cell table by.
By default, the measurements shown for each cell are Index, Frame, CellID, Bud, Stalk, ConnectedWith, CellLength, Stalklength, TrackID, and the mean intensity values in all fluorescence channels.
By clicking Select measurements, the displayed measurements can be adjusted (Hold Ctr to select multiple measurements).
Measurement fields
The following features/measurements are available:
Index(unique index in current table view)Frame(number of image frame, in which the cell is present)CellID(unique cell index per frame)
General cell features
Area(the area of the cell body (excluding stalk) in \(\mu m^2\))Orientation(angle with x-axis in which the cells lies)CellLength(the length of the cell body (excluding stalk) in \(\mu m\))CellWidth(maximum width of the cell body in \(\mu m\))CellSinuosity(ratio of the contour length and the end-to-end distance (straight line) of the cell body)
Stalk/Bud features
Stalk(cell has stalk: yes or no)StalkLength(in \(\mu m\))ConnectedWith(CellIDof bud in case the cell is connected to a bud)Bud(cell is bud: yes or no)
Intensity measurements (for channel “X”, watch the video tutorial “3. Analysis” for more details)
BrightestFocus_ChX_A_Distance(distance to first intensity maximum as measured from cell pole, in \(\mu m\))BrightestFocus_ChX_A_DistanceToCellCenter(distance to first intensity maximum as measured from cell center, in \(\mu m\))BrightestFocus_ChX_A_Intensity(intensity of first intensity maximum (averaged over the 3x3 neighboring pixels) as measured from cell pole)BrightestFocus_ChX_B_Distance(distance to first intensity maximum as measured from mother cell pole, takes stalk and bud into account, in \(\mu m\))BrightestFocus_ChX_B_Intensity(intensity of first intensity maximum (averaged over the 3x3 neighboring pixels) as measured from mother cell pole, takes stalk and bud into account)MinIntensity_ChXMaxIntensity_ChXMeanIntensity_ChXMedianIntensity_ChX
Metadata fields
TimePositionCustom(custom metadata)Filename_X(filename of channel “X”)
Tracking fields
TrackID(unique index per trajectory, stays the same for a cell through time)Parent(CellIDof parent cell in previous frame, in case the cell has divided in the meantime)Grandparent(CellIDof parent cell in second to last frame, in case the cell has divided in the meantime)
Cell-stalk-bud features
BudArea(area of associated bud (if existing) in \(\mu m^2\))BudLength(length of associated bud (if existing) in \(\mu m\))CellStalkLength(length of cell + associated stalk (if existing) in \(\mu m\))CellStalkBudLength(length of cell + associated stalk and bud (if existing) in \(\mu m\))StalkBudLength(length of associated stalk and bud (if existing) in \(\mu m\))
Additional information
CellDeleted(yes or no)Comment(if a cell was automatically marked asCellDeleted=1, the reason for this is stored here)StalkTouchesEdge(this field indicates if the cell touched the edge of the cell segmentation field or the specified ROI)
For Parent and Grandparent, only cell division via binary fission is taken into account.
Filtering can either be performed by using the filtering tool above the Cell list or by clicking on the table header (for advanced filtering and sorting).
Check the measurement field
Commentto see the reason why a cell was automatically marked asCellDeleted.To visualize a selected cell in the segmentation-tab click Show selected cell.
Custom measurement fields
By clicking Add custom in the panel Measurement fields a custom measurement can be defined based on an equation. Measurement fields have to be put in {brackets}. Arithmetric operators (+, -, *, /, ^), trigonometric functions and generally all scalar Matlab functions can be used here. If you are unsure whether a specific function exists or is supported, click Test formula to test it. Any custom measurement will appear in the measurements list and can also be modified or deleted afterwards.
Data visualization
All data visualizations are calculated based on the subset of cells shown in the main Cell list.
Histogram
Create a histogram of a selected measurement chosen from the drop-down menu. Either enter the number (default: 10) of bins or an array of bin-values (example: 1 2 3 4 5 or 1:1:5, in the latter one indicates the value of the first bin, the step size and the value of the last bin respectively).
Scatterplot
Create a scatterplot for two selected measurements, chosen from drop-down menus. If either BrightestFocus_ChX_A_Distance or BrightestFocus_ChX_B_Distance are plotted, BacStalk asks wether dots shall be colored according to the corresponding intensity value BrightestFocus_ChX_A_Intensity, i.e. BrightestFocus_ChX_B_Intensity, respectively.
Scatterplots are interactive: by clicking on a certain data point, BacStalk will display the corresponding cell.
Demograph
Create a demograph for the cells selected at What to plot.
Alignment: Cellular alignment. The available options depend on the developmental state of the cells. The following options are available (see Examples):
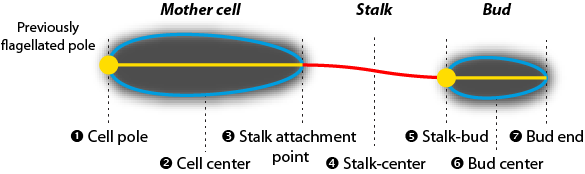
Developmental state |
Available alignment options |
|---|---|
All cells |
Cell pole (1), Cell center (2) |
Only cells w/o stalks |
Cell pole (1), Cell center (2) |
Only cells with stalks |
Cell pole (1), Cell center (2), Cell-stalk (3), Stalk center (4), Stalk end (5) |
Only cells with stalks w/o buds |
Cell pole (1), Cell center (2), Cell-stalk (3), Stalk center (4), Stalk end (5) |
Only cells with stalks connected to buds |
Cell pole of mother cell (1), Cell center of mother cell (2), Mother cell-stalk (3), Stalk center (4), Stalk-bud or stalk end (5), Cell center of bud (6), Cell pole of bud or bud end (7) |
Only buds |
Cell pole (1), Cell center (2) |
Only deleted cells |
Cell pole (1), Cell center (2) |
All cells incl. deleted cells |
Cell pole (1), Cell center (2) |
Measurement: Select the
channelon which the demograph is based.Type: If was checked during image processing, either the
meanormaxintensity along the medial axis can be displayed.
This option is not available if
Show full cell widthis enabled.When visualizing a fluorescent focus,
maxis a good choice. When the fluorescent signal is disperse in the cell,mean, might be a god choice.
Orientate cells: For cells w/o stalks the orientation is not clear and can therefore be selected. Either interactively adapt a cell’s orientation in the Segmentation view by clicking on the cell’s medial axis or determine it automatically based on the fluorescence intensity pattern.
Sort by: Sort the demograph depending on the cells developmental state:
Developmental state |
Available sort options |
|---|---|
All cells |
Cell length |
Only cells w/o stalks |
Cell length |
Only cells with stalks |
Cell length, Stalk length, Cell+stalk length |
Only cells with stalks w/o buds |
Cell length, Stalk length, Cell+stalk length |
Only cells with stalks connected to buds |
Mother cell length, Stalk length, Mother cell+stalk length, Bud length, Bud area, Mother cell+bud length, Mother cell+stalk+bud length |
Only buds |
Cell length |
Only deleted cells |
Cell length |
All cells incl. deleted cells |
Cell length |
The sort option Same order as shown in table is always available and can be used to create user-defined sorted demo-/kymographs.
Substract background: Subtract the global minimum intensity value from the demograph.
Intensity normalization: Normalize the intensity pattern of each cell (each row) by it’s maximum intensity value.
As intensity normalization ensures each cell in the demograph gets the same maximum value, demographs made via this setting do not lend themselves for distinguishing the difference between intensities in the different cells.
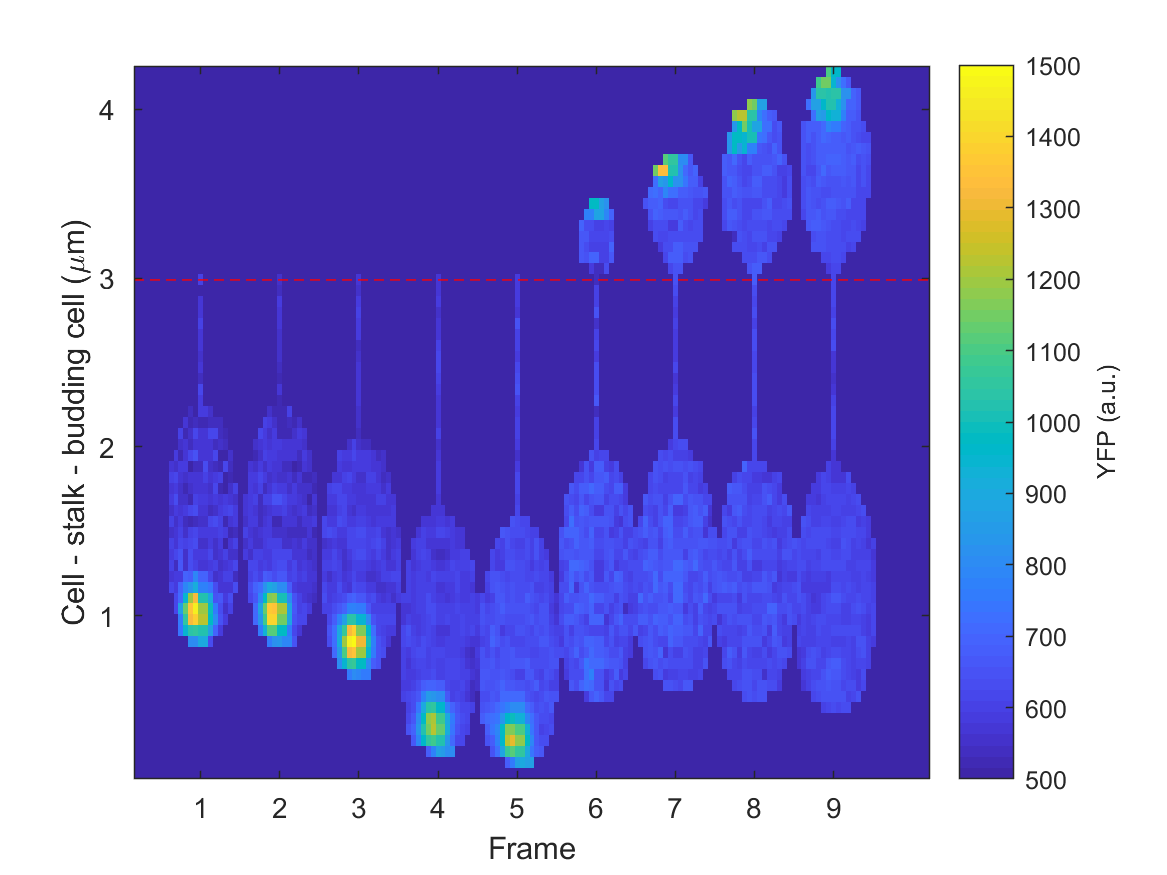
Show full cell width: Display the entire cell instead of only the medial axis or stalk intensity profile. Curved cells will be straightened. An example is shown at the section Examples
As the full-cell-representation retains both spatial dimensions, it makes the correlation between morphogenesis and localization of fluorescent pattern(s) possible. In addition, it resolves more complex fluorescence patterns inside cells. See the section Examples for some examples.
Demograph plots are interactive: by clicking on a certain cell, BacStalk will display it.
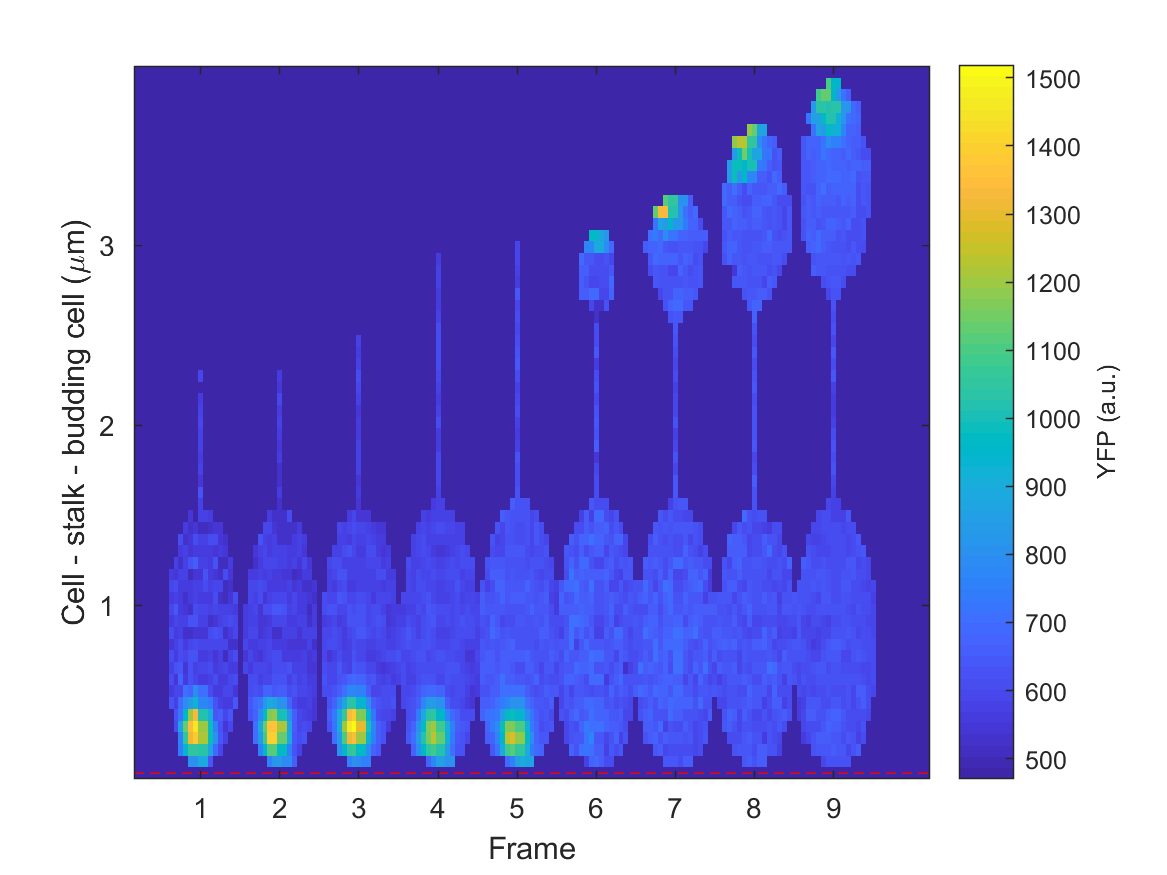
Kymograph
Create a kymograph of a selected cell within a track.
Either enter the TrackID and frame range of the desired track manually or click on an entry in the table Track to autofill these values. An explanation for the other parameters can be found in the section Demograph
Kymograph plots are interactive: by clicking on a certain cell, BacStalk will display it.
Demo- or kymographs combining multiple channels can be made using Tools. See RH can you make a proper link to Additional tools here?.
Examples
Classical demographs based on the cell medial axis profiles with different alignments.

Classical kymograph based on the cell medial axis profiles (alignment: Cell pole).
Kymograph of the same data with “full cell representation” enabled (alignment: Cell pole).
Same representation with stalk-bud alignment.