Additional tools
Merge two datasets
: Used to merge two experiments.
Both experiments have to include identical channel and metadata information!
Multichannel demo-/kymographs
- : Create multicolor demo- or kymographs by combining up to three individual channels in one image.
Create a demo-/kymograph and save it as a Matlab
fig-file.Create a demo-/kymograph from the same cells for a different channel and save it as a Matlab
fig-file.(Repeat for a 3rd channel if appropriate)
Call Tools –> Create multichannel demo-/kymograph and select the
fig-files and colors for the individual channels.
The combined demo- or kymograph might look nicer, if the colormap of the individual demo- or kymographs is adjusted. This needs to be done for each demo- or kymograph separately.
Export annotated images
: Save current segmentation view as png, jpeg or eps file (sequence).
Creates a new figure and copies all cells (+overlays) from the segmentation view to it. Afterwards the figure content can be modified.
Export annotated movie
: Create movie of your current segmentation view as image file sequence (png, jpeg or eps) or movie file (avi and mp4). Time metadata can be added as label of customizable fontsize and the framerate and movie quality can be set.
Custom Matlab scripts
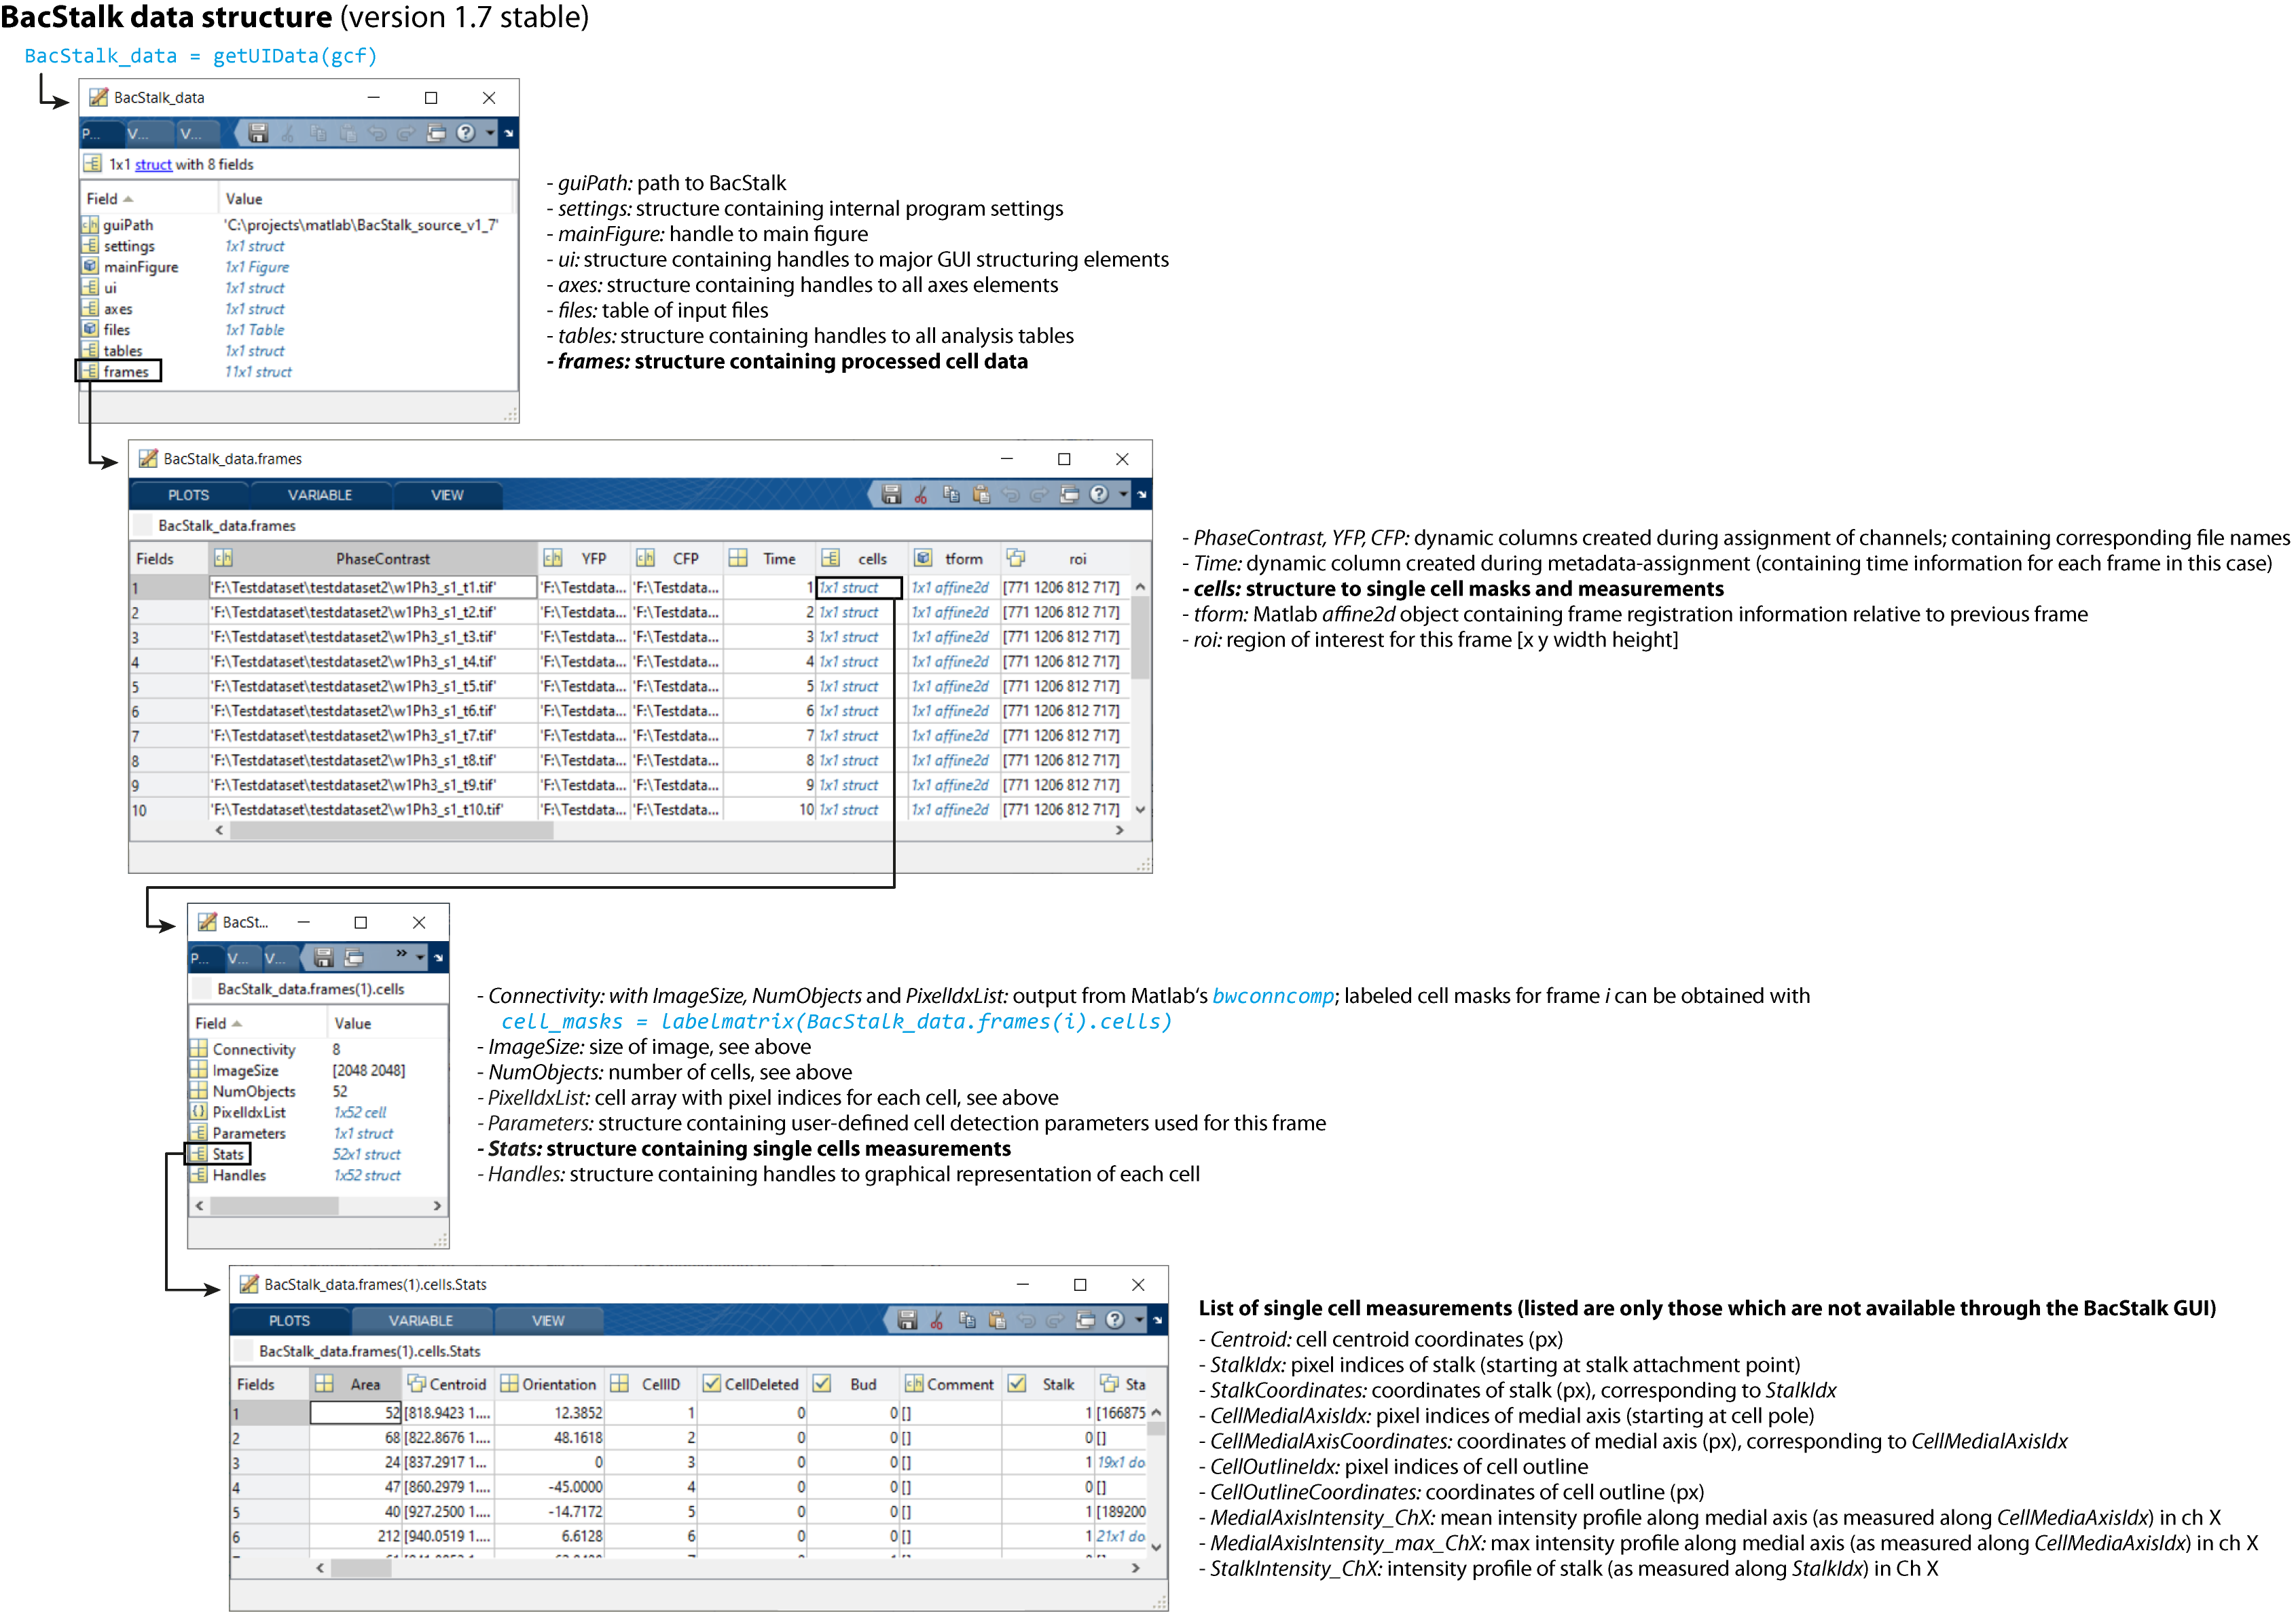
The cell/stalk segmentation data can be accessed in the following way for customized processing.
Run
BacStalk_data = getUIData(gcf);
to retrieve the underlying data and
setUIData(gcf, BacStalk_data);
to apply any changes and make them visible in the GUI.
The segmentation data is stored in the structure
BacStalk_data.frames
A detailled description of the raw data Matlab structures is shown in the following figure. The PDF-version can be downloaded here.