Data Export
The tab Data export offers several options to export the results of the segmentation and parameter calculation to common file formats.
3D-Visualization (VTK) files
VTK is a powerful 3D-file format for displaying and rendering 3D scientific data. For larger surface renderings, the visualization tools provided by MATLAB do not provide the needed performance to interactively explore your datasets. For the visualization of complex surface renderings including spatial distribution of objects parameters, we recommend ParaView.
Because the segmentation is based on single voxels, the results of the segmentation have more edges than the microscope images suggest. To reduce the file size and produce more realistic surface renderings, you can use the checkbox Reduce number of polygons by factor. In most cases the default value produces good results.
The option Rotate biofilm will modify the output orientation of the dataset.
In the dropdown menu Output format you can choose between VTK (Paraview) and STL (3D-printing). The STL format is useful for 3D-printing your segmented biofilm. Some 3D printing companies do not accept files with multiple object IDs. You can use the checkbox Force one object ID only to satisfy their requirements.
Flow Cytometry (FCS) files
The Flow Cytometry Standard (FCS) is a standardized file format for flow cytometry data. If you assume that all objects in your segmentation are (pseudo-)cells, and if each calculated object parameter is interpreted as a (pseudo-)cell cytometry parameter, you can create flow-cytometry-like datasets with BiofilmQ. All calculated properties can be visualized with a FCS-capable plotting program (e.g. FlowJo or many others).
Warning
Due to constraints in the definition of the FCS format, only positive values will be saved. All negative values will be set to zero!
Spreadsheet CSV-files
You can export all object properties as well as the global biofilm parameters for every frame to CSV-files. This is a text-file format which can be easily imported into a spreadsheet application of your choice (e.g. Microsoft Excel). If your data contains a time series, for each frame of the time series, the export function saves a separate file in the subfolder ‘/data/txt_output’ inside your experiment folder.
Matlab MAT-files
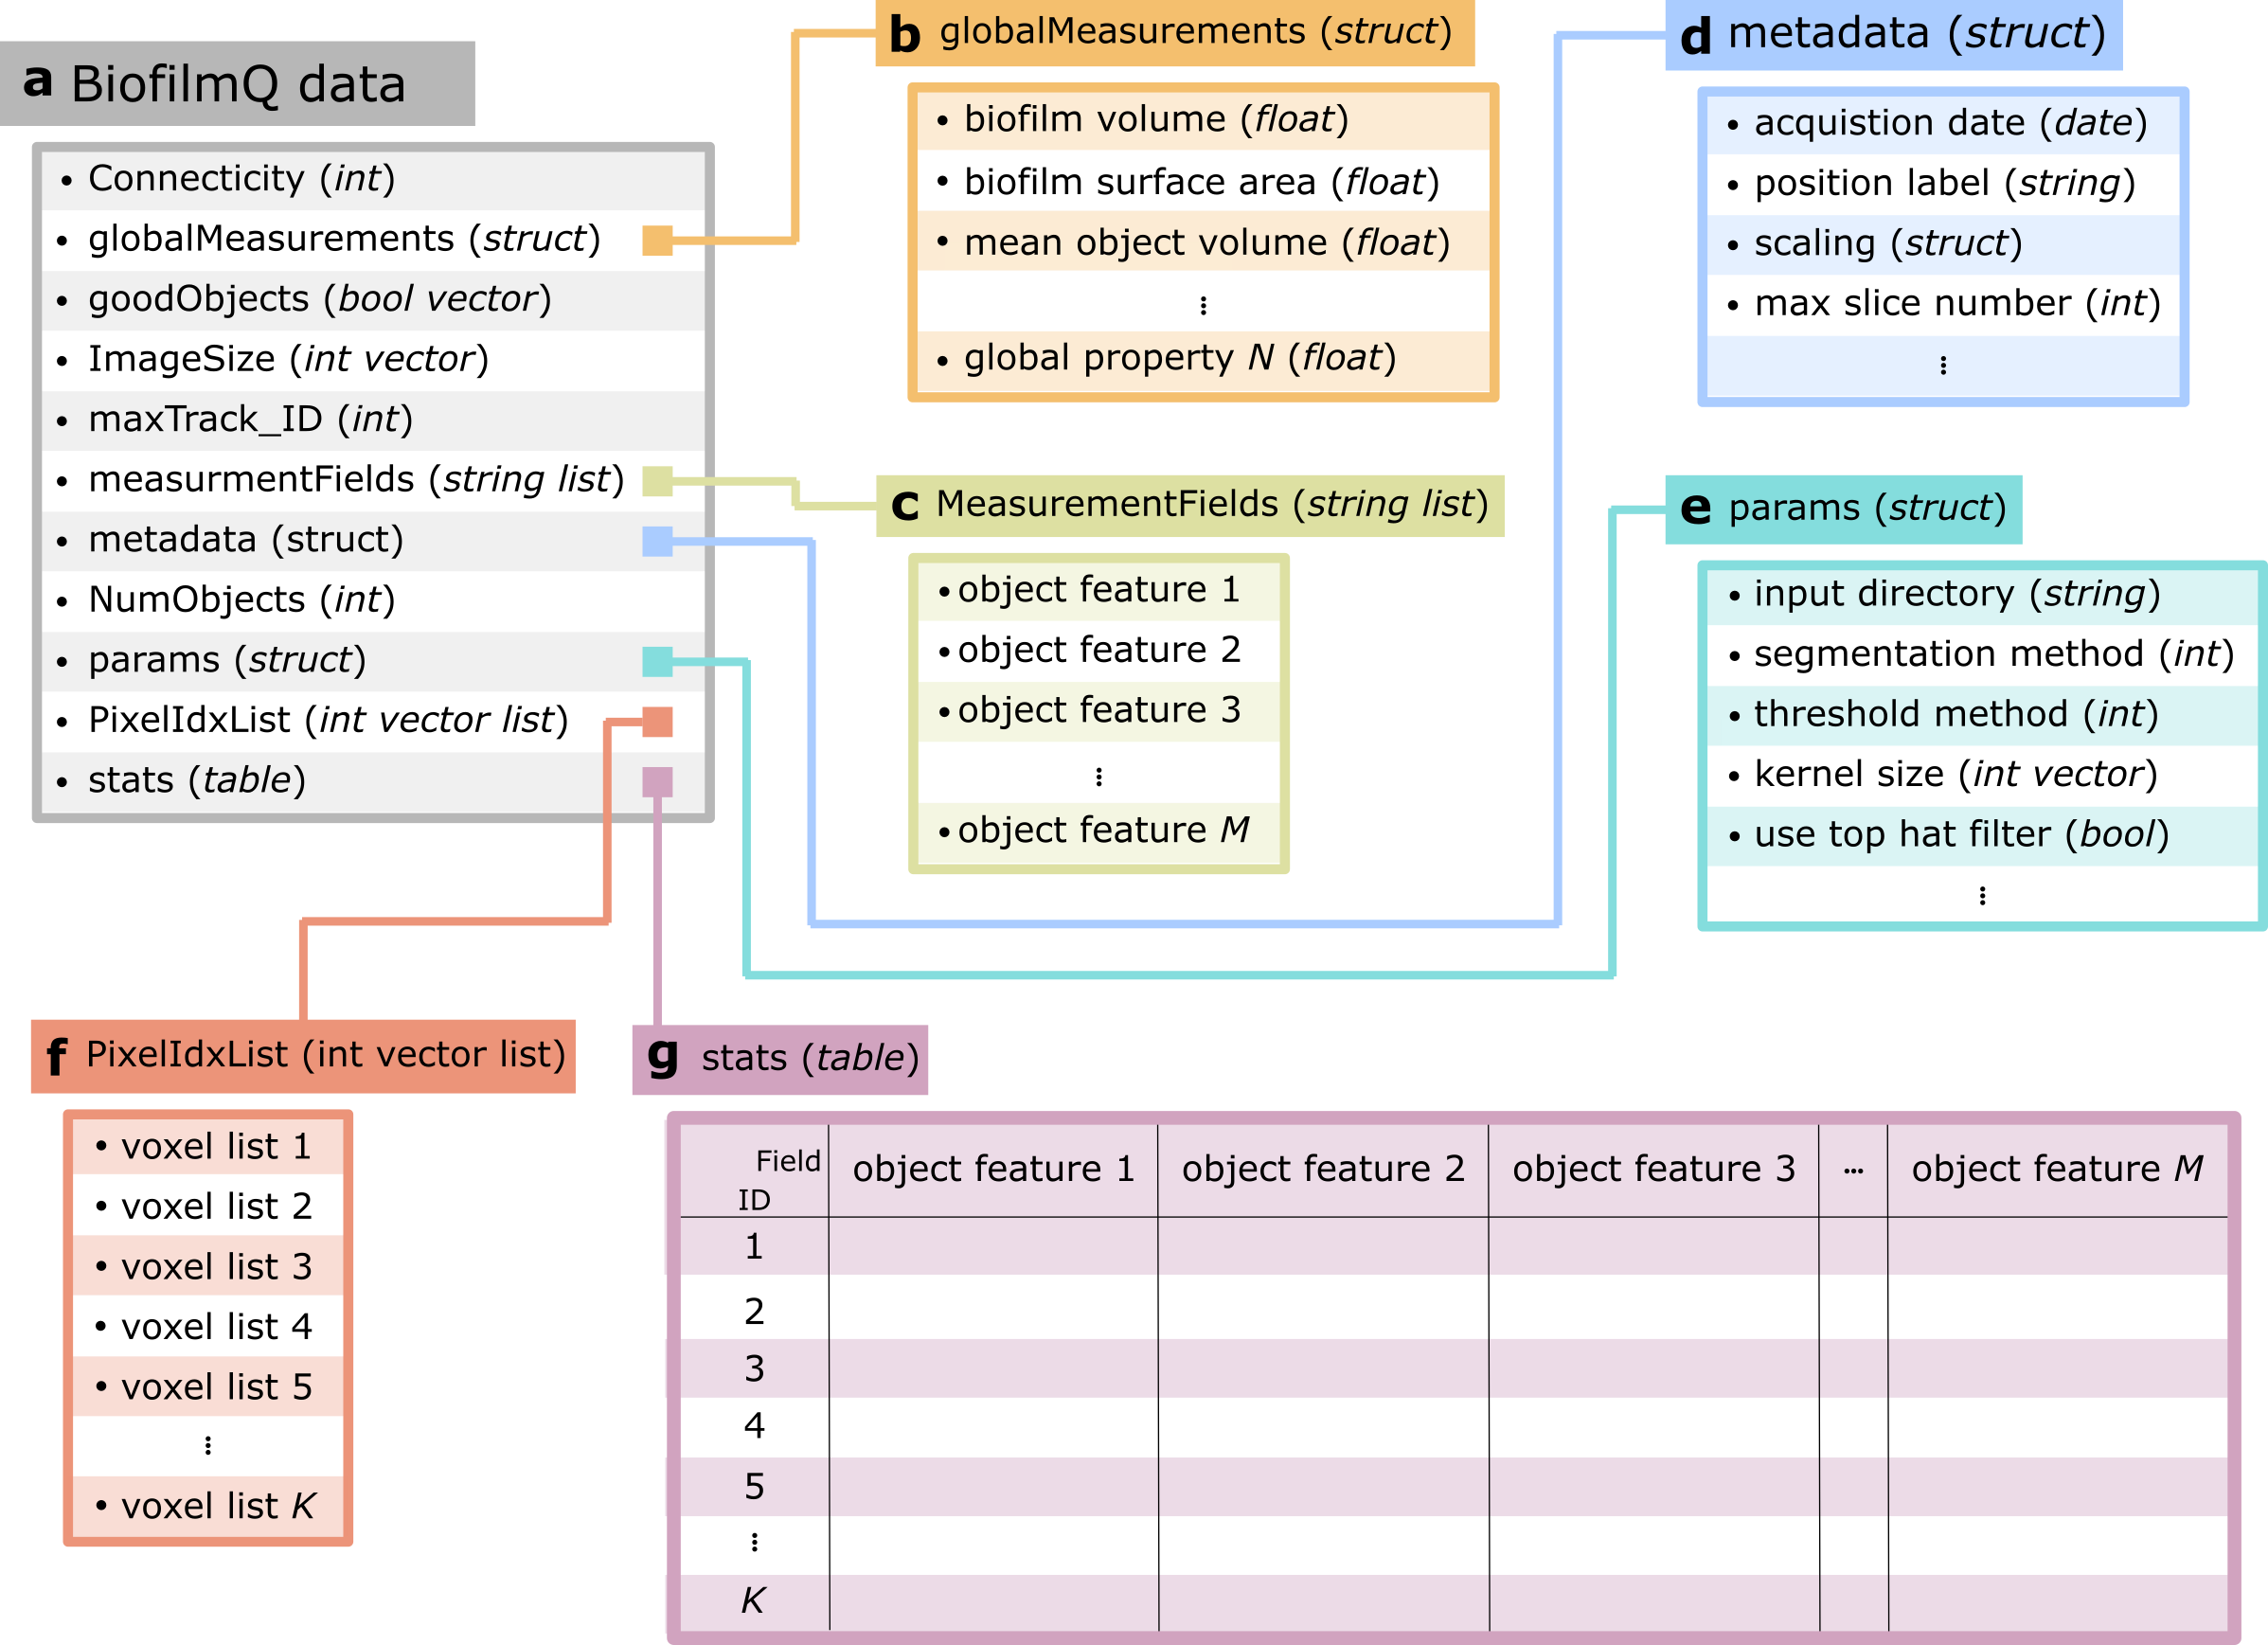
BiofimQ data structure. a For each time frame and for each channel a separate result file is generated which stores all information in a single structure. Besides the required information to create a label image (i.e. Connectivity, ImageSize, NumObjects, and PixelIdxList) it also contains information on the results of global biofilm measurements (globalMeasurements), information whether objects should be excluded from the analysis (goodObjects), the maximal lineage ID (maxTrack_ID), the names of the extracted object features (MeasurementsFields), the acquisition metadata (metadata), the GUI parameters (params), and a table which contains for every segmented object all values of the extracted features (stats). b globalMeasurements contain the information which is not assigned to a single object, but rather to the full image stack. (i.e the volume or surface area of the imaged biofilm, or the mean object volume for all objects inside the biofilm). c MeasurementFields contains the field names of all extracted features to quickly check the availability of a certain feature without loading all results into RAM. d The metadata of the acquisition are stored in the metadata structure (i.e. acquisition date, label for the current position, the information on the scale of a single voxel, or the number of z-slices during the acquisition). e The GUI parameters are stored in the params structure. This include all settings for all BiofilmQ modules. f The PixelIdxList contains for each object the index of the member voxels. g The results of the parameter calculation are stored in stats. For each object ID the corresponding object features are stored. . Figure adapted from [2].