Welcome to the BiofilmQ documentation!
BiofilmQ is an advanced biofilm analysis tool for quantifying the properties of cells inside 3-dimensional biofilm communities in space and time. It can work with many different kinds of 3D biofilm images, including flow-chamber biofilms, colonies on agar, pellicles, and aggregates.
BiofilmQ is based on a graphical user interface and does not require programming expertise or prior knowledge of image analysis.
BiofilmQ has two approaches for quantifying biofilm properties in space and time:
Case 1: The properties you are interested in do not require single cell detection or your image resolution is not sufficient to detect individual cells.
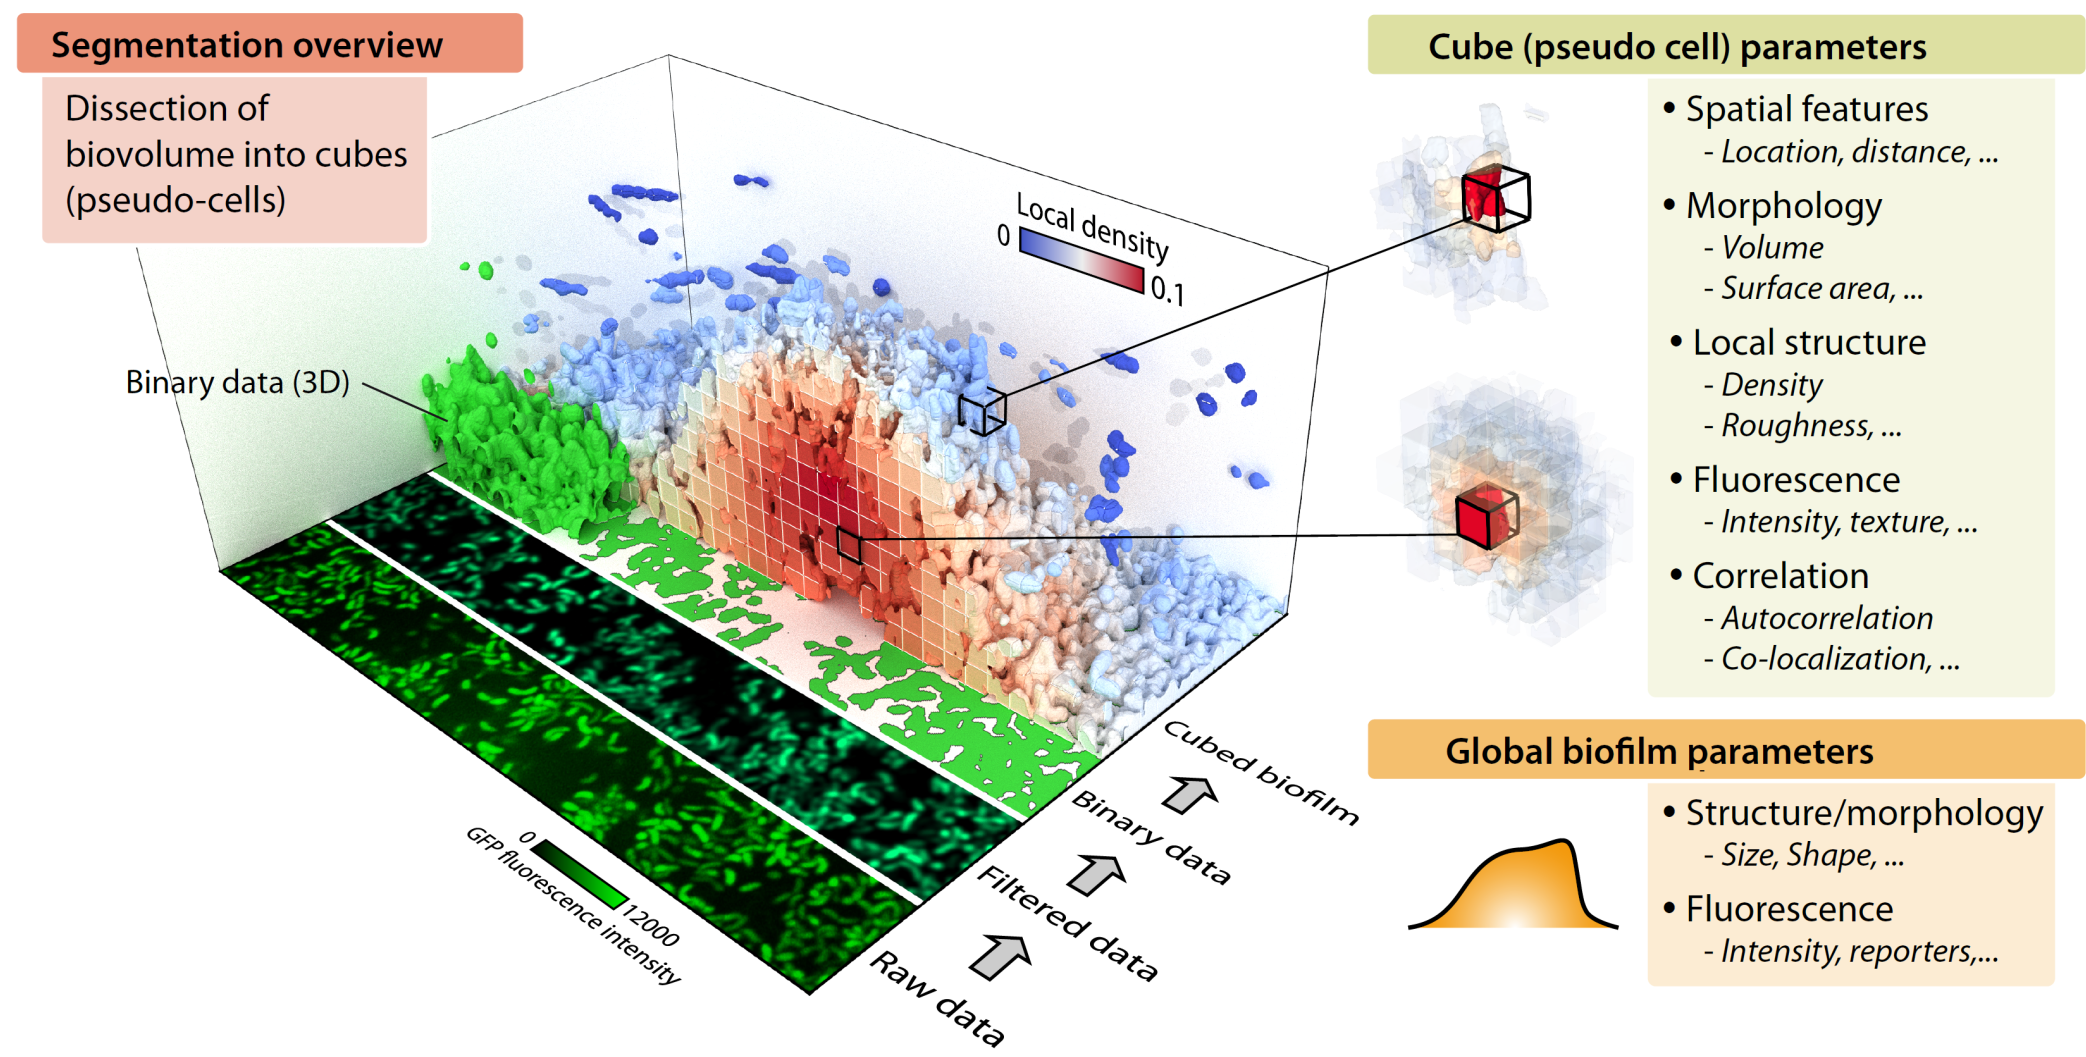
In this case, you can use the cube-based segmentation of BiofilmQ, during which the 3D biofilm biovolume is detected via thresholding and divided it into cubic pseudo-cells. Each cube is then treated as a single pseudo-cell for analysis purposes, for which fluorescence, architectural, spatial, and many more properties are measured. Using this cube-based approach, it is possible to analyze the biofilm-internal structure, by performing biofilm image cytometry (analogous to flow cytometry, but with spatial features), based on the quantification of many parameters for pseudo-cells.
Case 2: You already have a single-cell segmentation from another tool (e.g. our StarDist OPP tool) and would like to analyze single-cell data based on this segmentation.
In this case, you can import your segmentation into BiofilmQ using the label image approach. All subsequent analysis (parameter calculation, visualization, …) can then be performed as usual based on the imported segmentation. This option was added in the 2023 release of BiofilmQ version 1.0.0 and is the only way to analyze single-cell properties.
BiofilmQ provides powerful analysis and plotting functionality for quantifying and presenting the data from each pseudo-cell cube or each cell (depending on which of the use cases descibed above are used). For example, it is possible to generate biofilm kymographs, demographs, and to generate flow-cytometry-like datasets, including population gating, which include not just fluorescence and structural properties of cells, but also spatial properties within the biofilm.
The easy-to-use analysis and visualization features of BiofilmQ enable you to generate high-quality data figures without any programming skills.
For advanced users with programming expertise, all features are fully scriptable (in MATLAB) for batch processing of large datasets.
Overview
Getting started
Video tutorials
Join the forum!
We actively answer questions in the image.sc forum. If you have technical questions about BiofilmQ or find bugs, please use the image.sc forum.
More information
About us
BiofilmQ was developed by Raimo Hartmann, Hannah Jeckel, Eric Jelli, and Knut Drescher at the Max Planck Institute for Terrestrial Microbiology and the Department of Physics of the Philipps-Universität Marburg. For non-technical questions you can reach us at biofilmQ@gmail.com. For technical questions, problems, suggestions for improvements please use the image.sc forum.
How to cite
Please use the following reference for citing this software after you have used it:
Quantitative image analysis of microbial communities with BiofilmQ.Raimo Hartmann*, Hannah Jeckel*, Eric Jelli*, Praveen K. Singh, Sanika Vaidya, Miriam Bayer, Daniel K.H. Rode, Lucia Vidakovic, Francisco Díaz-Pascual, Jiunn C.N. Fong, Anna Dragoš, Olga Besharova, Janne G. Thöming, Niklas Netter, Susanne Häussler, Carey D. Nadell, Victor Sourjik, Ákos T. Kovács, Fitnat H. Yildiz, Knut Drescher.
(* equal contributions)
Nature Microbiology (2021). https://doi.org/10.1038/s41564-020-00817-4
Search
Credits
We would like to acknowledge the authors of the following MATLAB File Exchange contributions:
David Sampson and Ben Tordoff GUI Layout Toolbox
Ben Tordoff Splash Screen
Manuel Guizar Efficient subpixel image registration by cross-correlation
Reza Ahmadzadeh isToolboxAvailable
Ronald Ouwerkerk Neighbour points in a matrix
Stefan Doerr Progress bar for matlab loops (incl. parfor)
Daniel Terry parfor_progressbar
Yair Altman findjobj
Yair Altman UICOMPONENT - expands uicontrol to all Java classes
Carl Philips and Daniel Li cooc3d
Jakub Nedbal writeFCS(fname, DATA, TEXT, OTHER)
Guillaume Flandin mVTK - a VTK library for MATLAB
Yanai Ankri folderSizeTree
Philip Kollmannsberger skeleton3d-matlab
Bruno Luong FFT-based convolution
Jean-Yves Tinevez matlab-tree
Ohad Gal fit_ellipse
David Legland image ellipsoid 3D
Laszlo Balkay 2D Histogram Calculation
Sylvain Fiedler Cell Array to CSV-file [cell2csv.m]
Jake Hughey Ridler-Calvard image thresholding
Peter Hammer Marching Cubes
Igor Disk usage
Sven Holcombe stlwrite - write ASCII or Binary STL files
Masayuki Tanaka Noise Level Estimation from a Single Image
The Open Microscopy Environment Bio-Formats
Maysam Shahedi imshow3D
Yanai Ankri folderSizeTree
Chad Greene rgb2hex and hex2rgb
Paul Proteus Text progress bar
Olivier Salvado ordfilt3
Damien Garcia FSPECIAL3 Create predefined 3-D filters.
Jake Hughey Ridler-Calvard image thresholding
Krishnan Padmanabhan A novel algorithm for optimal image thresholding of biological data
Youssef Khmou 2D Autocorrelation function
Johannes Korsawe Minimal Bounding Box
Douglas Schwarz sort_nat: Natural Order Sort